Data Visualization and Reports
Industry 4.0 - IoT - BigData
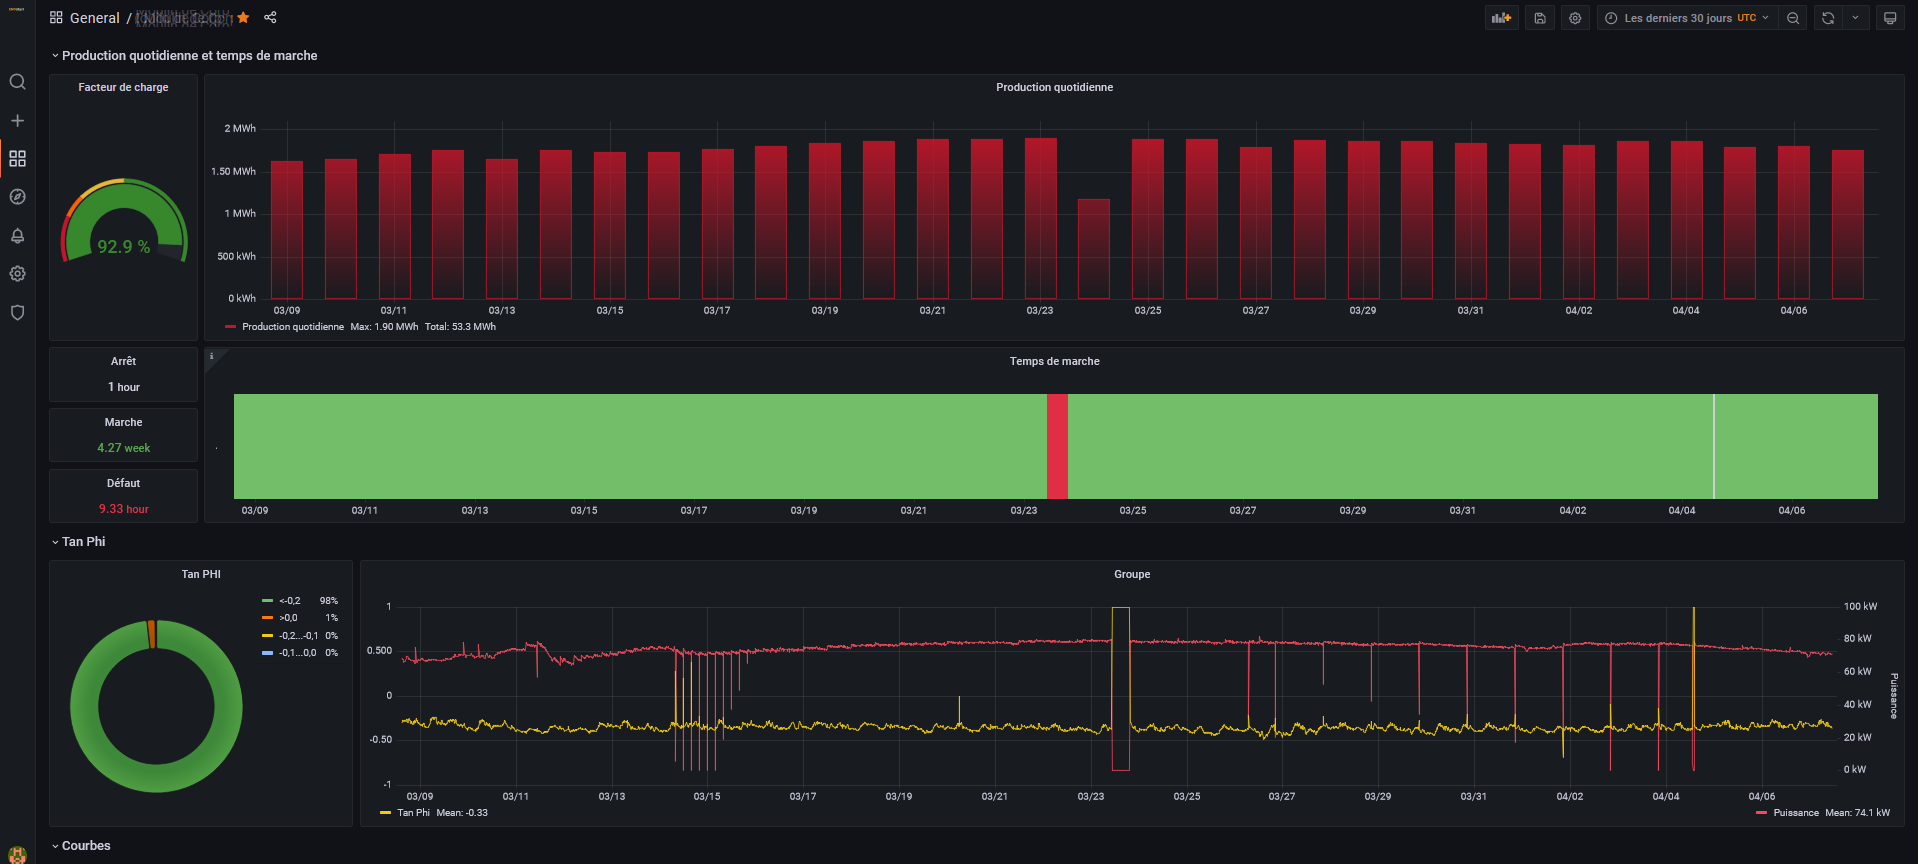

Our Data Visualization solutions transform your raw data into actionable information. Through the integration of IoT and BigData technologies, we collect, store and analyze all data from your installations, whether production data (power, levels, temperatures, speed, unit operating status, etc.) or alarms. It is also possible to enrich this database with information from Vigicrue or Météo France or others.
Dynamic dashboards offer a real-time view of your essential KPIs: production, availability, load factor, and much more. Each dashboard is customizable to your needs and includes features such as a logbook to record events. This facilitates data analysis, trend identification, unusual drift detection and thus helps optimize the efficiency of your installations.
Access to this platform is via a web server, ensuring compatibility with any type of device (PC, smartphone) and featuring a password-secured authentication system.
Key Features
Data Collection
Automatic and time-stamped data acquisition from all your installations, vigicrue, Météo France, etc.
Analysis
Transforms historized data into consolidated and valued data
Visualization
Interactive and customizable dashboards
Technical Specifications
- Industry 4.0 solutions
- IoT and BigData integration
- Dynamic dashboards
- Storage on local server and/or cloud
- Secure access
- Logbook for recording events
Report Types
- Daily production reports
- Monthly performance analysis
- Real-time KPIs
- Automatic alerts
- Historical comparisons
- Alarm log